6 Runtime inspection and debug
A debugger is a program that allows inspection of a running program. A debugger can start and run a program then stop at a specific line for examining the state of the program at that point. The point where the debugger stops (but does not halt) is called a breakpoint.
We will be using GDB, the GNU
Debugger, for debugging our kernel.
gdb is the program name. gdb can do four main
kinds of things:
Start your program, specifying anything that might affect its behavior.
Make your program stop on specified conditions.
Examine what has happened, when your program has stopped.
Change things in your program, so you can experiment with correcting the effects of one bug and go on to learn about another.
6.1 A sample program
There must be an existing program for debugging. The good old “Hello World” program suffices for the educational purpose in this chapter:
hello.c
#include <stdio.h>

int main(int argc, char *argv[])
{
    printf("Hello World!\n");
    return 0;
}
We compile it with debugging information with the option
-g:
$ gcc $BOOKFLAGS -g hello.c -o helloFinally, we start gdb with the program as argument:
$ gdb hellogdb displays assembly code in AT&T syntax by
default. To keep the Intel syntax used throughout this book, type this
command once gdb has started:
(gdb) set disassembly-flavor intelor put the line in the file ~/.gdbinit, which
gdb reads at every start. Every session in this chapter
assumes it.
6.2 Static inspection of a program
Before inspecting a program at runtime, gdb loads it
first. Upon loading into memory (but without running), a lot of useful
information can be retrieved for inspection. The commands in this
section can be used before the program runs. However, they are also
usable when the program runs and can display even more information.
6.2.1 Command:
info target, info file,
info files
This command prints the information of the target being debugged. A target is the debugged program.
Example 6.1. The output of the command from the
hello program, a local target, in detail:
(gdb) info target
Symbols from "/tmp/hello".
Local exec file:
        `/tmp/hello', file type elf32-i386.
        Entry point: 0x8049050
        0x080481b4 - 0x080481d8 is .note.gnu.build-id
        0x080481d8 - 0x080481eb is .interp
        0x080481ec - 0x0804820c is .gnu.hash
        0x0804820c - 0x0804825c is .dynsym
        0x0804825c - 0x080482b1 is .dynstr
        0x080482b2 - 0x080482bc is .gnu.version
        0x080482bc - 0x080482ec is .gnu.version_r
        0x080482ec - 0x080482f4 is .rel.dyn
        0x080482f4 - 0x08048304 is .rel.plt
        0x08049000 - 0x08049020 is .init
        0x08049020 - 0x08049050 is .plt
        0x08049050 - 0x08049194 is .text
        0x08049194 - 0x080491a8 is .fini
        0x0804a000 - 0x0804a015 is .rodata
        0x0804a018 - 0x0804a03c is .eh_frame_hdr
        0x0804a03c - 0x0804a0bc is .eh_frame
        0x0804a0bc - 0x0804a0dc is .note.ABI-tag
        0x0804bf00 - 0x0804bf04 is .init_array
        0x0804bf04 - 0x0804bf08 is .fini_array
        0x0804bf08 - 0x0804bff0 is .dynamic
        0x0804bff0 - 0x0804bff4 is .got
        0x0804bff4 - 0x0804c008 is .got.plt
        0x0804c008 - 0x0804c010 is .data
        0x0804c010 - 0x0804c014 is .bss
The output displayed reports:
Path of a symbol file. A symbol file is the file that contains the debugging information. Usually, this is the same file as the binary, but it is common to separate an executable binary and its debugging information into 2 files, especially for remote debugging. In the example, it is this line:
Symbols from "/tmp/hello".The path of the debugged program and its file type. In the example, it is this line:
Local exec file:
        `/tmp/hello', file type elf32-i386.
The entry point to the debugged program. That is, the very first code the program runs. In the example, it is this line:
Entry point: 0x8049050Note that the entry point is not
mainbut the start of the.textsection, where the_startfunction of the C runtime lives;_startprepares the process and then callsmain.A list of sections with their starting and ending addresses. In the example, it is the remaining output. These are the sections we met in chapter 5, The Anatomy of a Program; the
.eh_frameand.eh_frame_hdrsections are still there even though we compiled with-fno-asynchronous-unwind-tables, because they come from the C runtime files thatgcclinks into every program, not fromhello.c.
Example 6.2. If the debugged program runs in a
different machine, it is a remote target and gdb only
prints a brief information:
(gdb) info target
Remote target using gdb-specific protocol:
This is what we will see in chapter 7, Bootloader, when
gdb is connected to a machine emulated by QEMU.
6.2.2 Command:
maint info sections
This command is similar to info target but gives extra
information about program sections, specifically the file offset and the
flags of each section.
Example 6.3. Here is the output when running against
the hello program:
(gdb) maint info sections
Exec file: `/tmp/hello', file type elf32-i386.
 [0]      0x80481b4->0x80481d8 at 0x000001b4: .note.gnu.build-id ALLOC LOAD READONLY DATA HAS_CONTENTS
 [1]      0x80481d8->0x80481eb at 0x000001d8: .interp ALLOC LOAD READONLY DATA HAS_CONTENTS
 [2]      0x80481ec->0x804820c at 0x000001ec: .gnu.hash ALLOC LOAD READONLY DATA HAS_CONTENTS
 [3]      0x804820c->0x804825c at 0x0000020c: .dynsym ALLOC LOAD READONLY DATA HAS_CONTENTS
 [4]      0x804825c->0x80482b1 at 0x0000025c: .dynstr ALLOC LOAD READONLY DATA HAS_CONTENTS
 [5]      0x80482b2->0x80482bc at 0x000002b2: .gnu.version ALLOC LOAD READONLY DATA HAS_CONTENTS
 [6]      0x80482bc->0x80482ec at 0x000002bc: .gnu.version_r ALLOC LOAD READONLY DATA HAS_CONTENTS
 [7]      0x80482ec->0x80482f4 at 0x000002ec: .rel.dyn ALLOC LOAD READONLY DATA HAS_CONTENTS
 [8]      0x80482f4->0x8048304 at 0x000002f4: .rel.plt ALLOC LOAD READONLY DATA HAS_CONTENTS
 [9]      0x8049000->0x8049020 at 0x00001000: .init ALLOC LOAD READONLY CODE HAS_CONTENTS
 [10]     0x8049020->0x8049050 at 0x00001020: .plt ALLOC LOAD READONLY CODE HAS_CONTENTS
 [11]     0x8049050->0x8049194 at 0x00001050: .text ALLOC LOAD READONLY CODE HAS_CONTENTS
 [12]     0x8049194->0x80491a8 at 0x00001194: .fini ALLOC LOAD READONLY CODE HAS_CONTENTS
 [13]     0x804a000->0x804a015 at 0x00002000: .rodata ALLOC LOAD READONLY DATA HAS_CONTENTS
 [14]     0x804a018->0x804a03c at 0x00002018: .eh_frame_hdr ALLOC LOAD READONLY DATA HAS_CONTENTS
 [15]     0x804a03c->0x804a0bc at 0x0000203c: .eh_frame ALLOC LOAD READONLY DATA HAS_CONTENTS
 [16]     0x804a0bc->0x804a0dc at 0x000020bc: .note.ABI-tag ALLOC LOAD READONLY DATA HAS_CONTENTS
 [17]     0x804bf00->0x804bf04 at 0x00002f00: .init_array ALLOC LOAD DATA HAS_CONTENTS
 [18]     0x804bf04->0x804bf08 at 0x00002f04: .fini_array ALLOC LOAD DATA HAS_CONTENTS
 [19]     0x804bf08->0x804bff0 at 0x00002f08: .dynamic ALLOC LOAD DATA HAS_CONTENTS
 [20]     0x804bff0->0x804bff4 at 0x00002ff0: .got ALLOC LOAD DATA HAS_CONTENTS
 [21]     0x804bff4->0x804c008 at 0x00002ff4: .got.plt ALLOC LOAD DATA HAS_CONTENTS
 [22]     0x804c008->0x804c010 at 0x00003008: .data ALLOC LOAD DATA HAS_CONTENTS
 [23]     0x804c010->0x804c014 at 0x00003010: .bss ALLOC
 [24]     0x0000->0x001f at 0x00003010: .comment READONLY HAS_CONTENTS
 [25]     0x0000->0x0020 at 0x0000302f: .debug_aranges READONLY HAS_CONTENTS
 [26]     0x0000->0x00b3 at 0x0000304f: .debug_info READONLY HAS_CONTENTS
 [27]     0x0000->0x0064 at 0x00003102: .debug_abbrev READONLY HAS_CONTENTS
 [28]     0x0000->0x004f at 0x00003166: .debug_line READONLY HAS_CONTENTS
 [29]     0x0000->0x0040 at 0x000031b8: .debug_frame READONLY HAS_CONTENTS
 [30]     0x0000->0x00d3 at 0x000031f8: .debug_str READONLY HAS_CONTENTS
 [31]     0x0000->0x000d at 0x000032cb: .debug_line_str READONLY HAS_CONTENTS
The output is similar to info target, but with more
details. Each line shows the index of the section, its start and end
addresses in memory, the offset of its content in the file (after
at), and its name. Next to the section names are the
section flags, which are attributes of a section. Here, we can see that
the sections with the LOAD flag are from a
LOAD segment. The last sections, .comment and
the .debug_* sections produced by -g, have no
ALLOC flag and an address of 0x0000: they
exist in the file for gdb to read but are never loaded into
memory. The command can be combined with the section flags for filtered
outputs:
- ALLOBJ
-
displays sections for all loaded object files, including shared libraries. Shared libraries are only displayed when the program is already running.
- section names
-
displays only named sections.
::: {.example} Example 6.4. The command:
(gdb) maint info sections .text .data .bssonly displays the .text, .data and
.bss sections:
  Exec file: `/tmp/hello', file type elf32-i386.
   [11]     0x8049050->0x8049194 at 0x00001050: .text ALLOC LOAD READONLY CODE HAS_CONTENTS
   [22]     0x804c008->0x804c010 at 0x00003008: .data ALLOC LOAD DATA HAS_CONTENTS
   [23]     0x804c010->0x804c014 at 0x00003010: .bss ALLOC
:::
- section-flags
-
displays only sections with specified section flags. Note that these section flags are specific to
gdb, though they are based on the section attributes defined previously. Currently,gdbunderstands the following flags: - ALLOC
-
Section will have space allocated in the process when loaded. Set for all sections except those containing debug information.
- LOAD
-
Section will be loaded from the file into the child process memory. Set for pre-initialized code and data, clear for
.bsssections. - RELOC
-
Section needs to be relocated before loading.
- READONLY
-
Section cannot be modified by the child process.
- CODE
-
Section contains executable code only.
- DATA
-
Section contains data only (no executable code).
- ROM
-
Section will reside in ROM.
- CONSTRUCTOR
-
Section contains data for constructor/destructor lists.
- HAS_CONTENTS
-
Section is not empty.
- NEVER_LOAD
-
An instruction to the linker to not output the section.
- COFF_SHARED_LIBRARY
-
A notification to the linker that the section contains COFF shared library information. COFF is an object file format, similar to ELF. While ELF is the file format for an executable binary, COFF is the file format for an object file.
- IS_COMMON
-
Section contains common symbols.
::: {.example} Example 6.5. We can restrict the output to only display sections that contain code with the command:
(gdb) maint info sections CODEThe output:
  Exec file: `/tmp/hello', file type elf32-i386.
   [9]      0x8049000->0x8049020 at 0x00001000: .init ALLOC LOAD READONLY CODE HAS_CONTENTS
   [10]     0x8049020->0x8049050 at 0x00001020: .plt ALLOC LOAD READONLY CODE HAS_CONTENTS
   [11]     0x8049050->0x8049194 at 0x00001050: .text ALLOC LOAD READONLY CODE HAS_CONTENTS
   [12]     0x8049194->0x80491a8 at 0x00001194: .fini ALLOC LOAD READONLY CODE HAS_CONTENTS
:::
6.2.3 Command:
info functions
This command lists all function names and their loaded addresses. The names can be filtered with a regular expression.
Example 6.6. Running the command, we get the following output:
(gdb) info functions
All defined functions:

File hello.c:
3:      int main(int, char **);

Non-debugging symbols:
0x08049000  _init
0x08049030  __libc_start_main@plt
0x08049040  puts@plt
0x08049050  _start
0x0804907d  __wrap_main
0x08049090  _dl_relocate_static_pie
0x080490a0  __x86.get_pc_thunk.bx
0x080490b0  deregister_tm_clones
0x080490f0  register_tm_clones
0x08049130  __do_global_dtors_aux
0x08049160  frame_dummy
0x08049194  _fini
The functions with debugging information are listed first, grouped by
source file, each one prefixed by the line where it is defined:
main is declared at line 3 of hello.c. Then
come the non-debugging symbols: functions that gdb
only knows by name and address, because they were compiled without
-g. None of them is in hello.c; they are the C
runtime code that gcc links into every program, and the
@plt entries are the stubs through which the program calls
puts and __libc_start_main in the shared C
library.
6.2.4 Command:
info variables
This command lists all global and static variable names, or filtered with a regular expression.
Example 6.7. If we add a global variable
int i into the sample source program, recompile and run the
command, we get the following output:
(gdb) info variables
All defined variables:

File hello.c:
3:      int i;

Non-debugging symbols:
0x0804a000  _fp_hw
0x0804a004  _IO_stdin_used
0x0804a018  __GNU_EH_FRAME_HDR
0x0804a0b8  __FRAME_END__
0x0804a0bc  __abi_tag
0x0804bf00  __frame_dummy_init_array_entry
0x0804bf04  __do_global_dtors_aux_fini_array_entry
0x0804bf08  _DYNAMIC
0x0804bff4  _GLOBAL_OFFSET_TABLE_
0x0804c008  __data_start
0x0804c008  data_start
0x0804c00c  __dso_handle
0x0804c010  __TMC_END__
0x0804c010  __bss_start
0x0804c010  _edata
0x0804c010  completed
0x0804c018  _end
6.2.5 Command:
disassemble, disas
This command displays the assembly code of the executable file.
Example 6.8. gdb can display the
assembly code of a function:
(gdb) disassemble main
Dump of assembler code for function main:
   0x08049166 <+0>:     lea    ecx,[esp+0x4]
   0x0804916a <+4>:     and    esp,0xfffffff0
   0x0804916d <+7>:     push   DWORD PTR [ecx-0x4]
   0x08049170 <+10>:    push   ebp
   0x08049171 <+11>:    mov    ebp,esp
   0x08049173 <+13>:    push   ecx
   0x08049174 <+14>:    sub    esp,0x4
   0x08049177 <+17>:    sub    esp,0xc
   0x0804917a <+20>:    push   0x804a008
   0x0804917f <+25>:    call   0x8049040 <puts@plt>
   0x08049184 <+30>:    add    esp,0x10
   0x08049187 <+33>:    mov    eax,0x0
   0x0804918c <+38>:    mov    ecx,DWORD PTR [ebp-0x4]
   0x0804918f <+41>:    leave
   0x08049190 <+42>:    lea    esp,[ecx-0x4]
   0x08049193 <+45>:    ret
End of assembler dump.
Each line shows the address of an instruction, its offset from the
start of the function between angle brackets, and the instruction. Note
that gcc replaced the call to printf with a
call to puts, since the string ends with a newline and has
no format specifier.
Example 6.9. It would be more useful if source is included:
(gdb) disassemble /s main
Dump of assembler code for function main:
hello.c:
4       {
   0x08049166 <+0>:     lea    ecx,[esp+0x4]
   0x0804916a <+4>:     and    esp,0xfffffff0
   0x0804916d <+7>:     push   DWORD PTR [ecx-0x4]
   0x08049170 <+10>:    push   ebp
   0x08049171 <+11>:    mov    ebp,esp
   0x08049173 <+13>:    push   ecx
   0x08049174 <+14>:    sub    esp,0x4

5           printf("Hello World!\n");
   0x08049177 <+17>:    sub    esp,0xc
   0x0804917a <+20>:    push   0x804a008
   0x0804917f <+25>:    call   0x8049040 <puts@plt>
   0x08049184 <+30>:    add    esp,0x10

6           return 0;
   0x08049187 <+33>:    mov    eax,0x0

7       }
   0x0804918c <+38>:    mov    ecx,DWORD PTR [ebp-0x4]
   0x0804918f <+41>:    leave
   0x08049190 <+42>:    lea    esp,[ecx-0x4]
   0x08049193 <+45>:    ret
End of assembler dump.
Now the high level source, each line prefixed by its line number, is included as part of the assembly dump. Each line is backed by the corresponding assembly code below it.
Example 6.10. If the option /r is
added, raw instructions in hex are included, just like how
objdump displays assembly code by default:
(gdb) disassemble /rs main
Dump of assembler code for function main:
hello.c:
4       {
   0x08049166 <+0>:     8d 4c 24 04             lea    ecx,[esp+0x4]
   0x0804916a <+4>:     83 e4 f0                and    esp,0xfffffff0
   0x0804916d <+7>:     ff 71 fc                push   DWORD PTR [ecx-0x4]
   0x08049170 <+10>:    55                      push   ebp
   0x08049171 <+11>:    89 e5                   mov    ebp,esp
   0x08049173 <+13>:    51                      push   ecx
   0x08049174 <+14>:    83 ec 04                sub    esp,0x4

5           printf("Hello World!\n");
   0x08049177 <+17>:    83 ec 0c                sub    esp,0xc
   0x0804917a <+20>:    68 08 a0 04 08          push   0x804a008
   0x0804917f <+25>:    e8 bc fe ff ff          call   0x8049040 <puts@plt>
   0x08049184 <+30>:    83 c4 10                add    esp,0x10

6           return 0;
   0x08049187 <+33>:    b8 00 00 00 00          mov    eax,0x0

7       }
   0x0804918c <+38>:    8b 4d fc                mov    ecx,DWORD PTR [ebp-0x4]
   0x0804918f <+41>:    c9                      leave
   0x08049190 <+42>:    8d 61 fc                lea    esp,[ecx-0x4]
   0x08049193 <+45>:    c3                      ret
End of assembler dump.
Example 6.11. A function in a specific file can also be specified:
(gdb) disassemble /sr 'hello.c'::main
Dump of assembler code for function main:
hello.c:
4       {
   0x08049166 <+0>:     8d 4c 24 04             lea    ecx,[esp+0x4]
   0x0804916a <+4>:     83 e4 f0                and    esp,0xfffffff0
   0x0804916d <+7>:     ff 71 fc                push   DWORD PTR [ecx-0x4]
   0x08049170 <+10>:    55                      push   ebp
   0x08049171 <+11>:    89 e5                   mov    ebp,esp
   0x08049173 <+13>:    51                      push   ecx
   0x08049174 <+14>:    83 ec 04                sub    esp,0x4

5           printf("Hello World!\n");
   0x08049177 <+17>:    83 ec 0c                sub    esp,0xc
   0x0804917a <+20>:    68 08 a0 04 08          push   0x804a008
   0x0804917f <+25>:    e8 bc fe ff ff          call   0x8049040 <puts@plt>
   0x08049184 <+30>:    83 c4 10                add    esp,0x10

6           return 0;
   0x08049187 <+33>:    b8 00 00 00 00          mov    eax,0x0

7       }
   0x0804918c <+38>:    8b 4d fc                mov    ecx,DWORD PTR [ebp-0x4]
   0x0804918f <+41>:    c9                      leave
   0x08049190 <+42>:    8d 61 fc                lea    esp,[ecx-0x4]
   0x08049193 <+45>:    c3                      ret
End of assembler dump.
The filename must be included in single quotes, and the function must
be prefixed by a double colon, e.g. 'hello.c'::main to
specify disassembling of the function main in the file
hello.c.
6.2.6 Command: x
This command examines the content of a given memory range.
Example 6.12. We can examine the raw content in
main:
(gdb) x main
0x8049166 <main>:       0x04244c8d
By default, without any argument, the command only prints the content
of a single memory address, as a 4-byte word. In this case, that is the
starting memory address of main. Compare it with the raw
bytes of the first instruction in example 6.10,
8d 4c 24 04: they are the same bytes, read as one
little-endian number.
Example 6.13. With format arguments, the command can print a range of memory in a specific format.
(gdb) x/20xb main
0x8049166 <main>:       0x8d    0x4c    0x24    0x04    0x83    0xe4    0xf0    0xff
0x804916e <main+8>:     0x71    0xfc    0x55    0x89    0xe5    0x51    0x83    0xec
0x8049176 <main+16>:    0x04    0x83    0xec    0x0c
The argument /20xb main means that the command prints 20
bytes, in hex, from where main starts in memory.
The general form for the format argument is:
/<repeat count><format letter><size letter>
If the repeat count is not supplied, by default gdb
supplies the count as 1. The format letter is one of the following
values:
| Letter | Description |
|---|---|
o |
Print the memory content in octal format. |
x |
Print the memory content in hex format. |
d |
Print the memory content in decimal format. |
u |
Print the memory content in unsigned decimal format. |
t |
Print the memory content in binary format. |
f |
Print the memory content in float format. |
a |
Print the memory content as memory addresses. |
i |
Print the memory content as a series of
assembly instructions, similar to disassemble command. |
c |
Print the memory content as an array of ASCII characters. |
s |
Print the memory content as a string |
The size letter is one of b (byte), h
(halfword, 2 bytes), w (word, 4 bytes) or g
(giant word, 8 bytes). Both letters are optional; when the format letter
is omitted, as in x/20b main, gdb 16 prints
the bytes as signed decimal numbers (-115 76 36 4 ...),
which is not what we want for reading machine code, hence the
x.
Depending on the circumstance, a certain format is more advantageous
than the others. For example, if a memory region contains floating-point
numbers, then it is better to use the format f than viewing
the numbers as separate 1-byte hex numbers.
6.2.7 Command: print,
p
Examining raw memory is useful but usually it is better to have a more human-readable output. This command does precisely the task: it pretty-prints an expression. An expression can be a global variable, a local variable in the current stack frame, a function, a register, a number, etc.
6.3 Runtime inspection of a program
The main use of a debugger is to examine the state of a program, when
it is running. gdb provides a set of useful commands for
retrieving useful runtime information.
6.3.1 Command: run
This command starts running the program.
Example 6.14. Run the hello program:
(gdb) r
Starting program: /tmp/hello
[Thread debugging using libthread_db enabled]
Using host libthread_db library "/lib/x86_64-linux-gnu/libthread_db.so.1".
Hello World!
[Inferior 1 (process 145) exited normally]
The program runs successfully and printed the message “Hello World”.
The two lines about libthread_db are gdb
loading a helper library for debugging multi-threaded programs; they
appear every time a program starts and we omit them from the listings
that follow. If you work inside the container of chapter 0,
gdb may also print
warning: Error disabling address space randomization: Operation not permitted:
gdb normally switches off the randomization of the stack
and library addresses of the program it runs, so that a bug reproduces
at the same addresses from one run to the next, and a container started
with the default security profile does not allow it. The warning is
harmless for us, since our programs are linked at fixed addresses; to
get rid of it, add --security-opt seccomp=unconfined to the
docker run command.
However, it would not be useful if all gdb can do is run
a program.
6.3.2 Command: break,
b
This command sets a breakpoint at a location in the high-level source
code. When gdb runs to a specific location marked by a
breakpoint, it stops executing for a programmer to inspect the current
state of a program.
Example 6.15. A breakpoint can be set on a line as
displayed by an editor. Suppose we want to set a breakpoint at line 3 of
the program, which is the start of the main function:
hello.c
When running the program, instead of running from start to finish,
gdb stops in main:
(gdb) b 3
Breakpoint 1 at 0x8049177: file hello.c, line 5.
(gdb) r
Starting program: /tmp/hello

Breakpoint 1, main (argc=1, argv=0xffffddc4) at hello.c:5
5           printf("Hello World!\n");
The breakpoint was requested at line 3, but gdb placed
it at line 5 and says so as soon as the breakpoint is set. The reason is
that line 3 does not contain code, but a function signature;
gdb only stops where it can execute code. The code in the
function starts at line 5, the call to printf, so
gdb stops there. The address 0x8049177 is the
first instruction of line 5, sub esp,0xc in example 6.9,
right after the prologue of main.
Example 6.16. A line of code is not always a
reliable way to specify a breakpoint, as the source code can be changed.
What if gdb should always stop at the main
function? In this case, a better method is to use the function name
directly:
(gdb) b mainThen, regardless of how the source code changes, gdb
always stops at the main function.
Example 6.17. Sometimes, the debugged program does
not contain debug info, or gdb is debugging assembly code.
In that case, a memory address can be specified as a stop point. To get
the function address, the print command can be used:
(gdb) print main
$1 = {int (int, char **)} 0x8049166 <main>
Knowing the address of main, we can easily set a
breakpoint with a memory address:
(gdb) b *0x8049166Example 6.18. gdb can also set a
breakpoint in any source file. Suppose that the hello
program is composed not just of one file but of many files
e.g. hello1.c, hello2.c,
hello3.c… In that case, simply add the filename before the
line number:
(gdb) b hello.c:3Example 6.19. A function name in a specific file can also be set:
(gdb) b hello.c:main6.3.3 Command: next,
n
This command executes the current line and stops at the next line. When the current line is a function call, it steps over it.
Example 6.20. After setting a breakpoint at
main, run the program and stop at the first
printf:
(gdb) b main
Breakpoint 1 at 0x8049177: file hello.c, line 5.
(gdb) r
Starting program: /tmp/hello

Breakpoint 1, main (argc=1, argv=0xffffddc4) at hello.c:5
5           printf("Hello World!\n");
Then, to proceed to the next statement, we use the next
command:
(gdb) n
Hello World!
6           return 0;
In the output, the first line shows the output produced after
executing line 5; then, the next line shows where gdb
currently stops, which is line 6.
6.3.4 Command: step,
s
This command executes the current line and stops at the next line. When the current line is a function call, it steps into it to the first line in the called function.
Example 6.21. Suppose we have a new function
add1:
hello.c
#include <stdio.h>

int add(int a, int b) {
    return a + b;
}

int main(int argc, char *argv[])
{
    add(1, 2);
    printf("Hello World!\n");
    return 0;
}
If the step command is used instead of next
on the function call add, gdb steps inside the
function:
(gdb) b main
Breakpoint 1 at 0x8049184: file hello.c, line 9.
(gdb) r
Starting program: /tmp/hello

Breakpoint 1, main (argc=1, argv=0xffffddc4) at hello.c:9
9           add(1, 2);
(gdb) s
add (a=1, b=2) at hello.c:4
4           return a + b;
After executing the command s, gdb stepped
into the add function where the first statement is a
return.
6.3.5 Command: ni
At the core, gdb operates on assembly instructions.
Source line by line debugging is simply an enhancement to make it
friendlier for programmers. Each statement in C translates to one or
more assembly instructions, as shown with the objdump and
disassemble commands. With the debug info available,
gdb knows how many instructions belong to one line of
high-level code; line by line debugging is just the execution of the
assembly instructions of a line when moving from the current line to the
next.
This command executes one assembly instruction belonging to
the current line. Until all assembly instructions of the current line
are executed, gdb will not move to the next line. If the
current instruction is a call, it steps over it to the next
instruction.
Example 6.22. When the breakpoint is on the
printf call and ni is used, it steps through
each assembly instruction. First, we stop at the breakpoint and look at
where we are; disassemble marks the current instruction
with =>:
(gdb) b main
Breakpoint 1 at 0x8049177: file hello.c, line 5.
(gdb) r
Starting program: /tmp/hello

Breakpoint 1, main (argc=1, argv=0xffffddc4) at hello.c:5
5           printf("Hello World!\n");
(gdb) disassemble /s main
Dump of assembler code for function main:
hello.c:
4       {
   0x08049166 <+0>:     lea    ecx,[esp+0x4]
   0x0804916a <+4>:     and    esp,0xfffffff0
   0x0804916d <+7>:     push   DWORD PTR [ecx-0x4]
   0x08049170 <+10>:    push   ebp
   0x08049171 <+11>:    mov    ebp,esp
   0x08049173 <+13>:    push   ecx
   0x08049174 <+14>:    sub    esp,0x4

5           printf("Hello World!\n");
=> 0x08049177 <+17>:    sub    esp,0xc
   0x0804917a <+20>:    push   0x804a008
   0x0804917f <+25>:    call   0x8049040 <puts@plt>
   0x08049184 <+30>:    add    esp,0x10

6           return 0;
   0x08049187 <+33>:    mov    eax,0x0

7       }
   0x0804918c <+38>:    mov    ecx,DWORD PTR [ebp-0x4]
   0x0804918f <+41>:    leave
   0x08049190 <+42>:    lea    esp,[ecx-0x4]
   0x08049193 <+45>:    ret
End of assembler dump.
Then we execute line 5 one instruction at a time:
(gdb) ni
0x0804917a      5           printf("Hello World!\n");
(gdb) ni
0x0804917f      5           printf("Hello World!\n");
(gdb) ni
Hello World!
0x08049184      5           printf("Hello World!\n");
(gdb) ni
6           return 0;
Upon entering ni, gdb executes the current
instruction and displays the next instruction. That is why,
from the output, gdb only displays 3 addresses:
0x0804917a, 0x0804917f and
0x08049184. The instruction at 0x08049177,
which is the first instruction of line 5, is not displayed because it is
the instruction that gdb stopped at. The third
ni executes the call to puts as a
single step, which is why “Hello World!” appears there. After the fourth
ni, all instructions of line 5 are executed and
gdb reports line 6, without an address, since we are at the
start of a line. When gdb stops at the first instruction of
a line, as it did at 0x08049177, the current instruction
can be displayed using the x command:
(gdb) x/i $eip
=> 0x8049177 <main+17>: sub    esp,0xc
6.3.6 Command: si
Similar to ni, this command executes the current
assembly instruction belonging to the current line. But if the current
instruction is a call, it steps into it to the first
instruction in the called function.
Example 6.23. Recall that the assembly code
generated from printf contains a call
instruction at 0x0804917f, as shown in the listing of
example 6.22. We try instruction by instruction stepping again, but this
time by running si at 0x0804917f, where the
call resides:
(gdb) b main
Breakpoint 1 at 0x8049177: file hello.c, line 5.
(gdb) r
Starting program: /tmp/hello

Breakpoint 1, main (argc=1, argv=0xffffddc4) at hello.c:5
5           printf("Hello World!\n");
(gdb) si
0x0804917a      5           printf("Hello World!\n");
(gdb) si
0x0804917f      5           printf("Hello World!\n");
(gdb) x/i $eip
=> 0x804917f <main+25>: call   0x8049040 <puts@plt>
(gdb) si
0x08049040 in puts@plt ()
The next instruction right after 0x0804917f is the first
instruction at 0x08049040 in the puts@plt
stub, which jumps to the puts function of the C library. In
other words, gdb stepped into puts instead of
stepping over it. The C library was compiled without debugging
information, so gdb can only show an address and a name,
not a source line.
6.3.7 Command: until
This command executes until the next line is greater than the current line.
Example 6.24. Suppose we have a function that executes a long loop:
hello.c
#include <stdio.h>

int add1000() {
    int total = 0;

    for (int i = 0; i < 1000; ++i){
        total += i;
    }

    printf("Done adding!\n");

    return total;
}

int main(int argc, char *argv[])
{
    add1000();
    printf("Hello World!\n");
    return 0;
}
Using the next command, we need to press 1000 times for
finishing the loop. Instead, a faster way is to use
until:
(gdb) b add1000
Breakpoint 1 at 0x804916c: file hello.c, line 4.
(gdb) r
Starting program: /tmp/hello

Breakpoint 1, add1000 () at hello.c:4
4           int total = 0;
(gdb) until
6           for (int i = 0; i < 1000; ++i){
(gdb) until
7               total += i;
(gdb) until
6           for (int i = 0; i < 1000; ++i){
(gdb) until
10          printf("Done adding!\n");
Executing the first until, gdb stopped at
line 6 since line 6 is greater than line 4.
Executing the second until, gdb stopped at
line 7 since line 7 is greater than line 6.
Executing the third until, gdb stopped at
line 6 since the loop still continues. Because line 6 is less than line
7, with the fourth until, gdb kept executing
until it did not go back to line 6 anymore and stopped at line 10. This
is a great way to skip over a loop in the middle, instead of setting an
unneeded breakpoint.
Example 6.25. until can be supplied
with an argument to explicitly execute to a specific line:
(gdb) r
Starting program: /tmp/hello

Breakpoint 1, add1000 () at hello.c:4
4           int total = 0;
(gdb) until 10
add1000 () at hello.c:10
10          printf("Done adding!\n");
6.3.8 Command: finish
This command executes until the end of a function and displays the
return value. finish is actually just a more convenient
version of until.
Example 6.26. Using the add1000
function from the previous example and finish instead of
until:
(gdb) r
Starting program: /tmp/hello

Breakpoint 1, add1000 () at hello.c:4
4           int total = 0;
(gdb) finish
Run till exit from #0  add1000 () at hello.c:4
Done adding!
main (argc=1, argv=0xffffddc4) at hello.c:18
18          printf("Hello World!\n");
Value returned is $1 = 499500
gdb returned to main and stopped at line
18, the line after the call: since the value of add1000()
is discarded, no instruction of line 17 remains to be executed after the
call returns, and the return address is the first instruction of line
18.
6.3.9 Command: bt
This command prints the backtrace of all stack frames. A backtrace is a list of currently active functions:
Example 6.27. Suppose we have a chain of function calls:
hello.c
void d(int d) { };
void c(int c) { d(0); }
void b(int b) { c(1); }
void a(int a) { b(2); }

int main(int argc, char *argv[])
{
    a(3);
    return 0;
}
bt can visualize such a chain in action:
(gdb) b a
Breakpoint 1 at 0x804917f: file hello.c, line 4.
(gdb) r
Starting program: /tmp/hello

Breakpoint 1, a (a=3) at hello.c:4
4       void a(int a) { b(2); }
(gdb) s
b (b=2) at hello.c:3
3       void b(int b) { c(1); }
(gdb) s
c (c=1) at hello.c:2
2       void c(int c) { d(0); }
(gdb) s
d (d=0) at hello.c:1
1       void d(int d) { };
(gdb) bt
#0  d (d=0) at hello.c:1
#1  0x08049166 in c (c=1) at hello.c:2
#2  0x08049176 in b (b=2) at hello.c:3
#3  0x08049186 in a (a=3) at hello.c:4
#4  0x08049196 in main (argc=1, argv=0xffffddc4) at hello.c:8
Most-recent calls are placed on top and least-recent calls are near
the bottom. In this case, d is the most current active
function, so it has the index 0. Next is c, the
2nd active function, which has the index 1 and so on with
function b, function a, and finally function
main at the bottom, the least-recent function. The address
next to each frame is where that function resumes when the function
above it returns, i.e. the instruction right after the
call. That is how we read a backtrace.
6.3.10 Command: up
This command goes up one frame earlier than the current frame.
Example 6.28. Instead of staying in the
d function, we can go up to the c function and
look at its state:
(gdb) bt
#0  d (d=0) at hello.c:1
#1  0x08049166 in c (c=1) at hello.c:2
#2  0x08049176 in b (b=2) at hello.c:3
#3  0x08049186 in a (a=3) at hello.c:4
#4  0x08049196 in main (argc=1, argv=0xffffddc4) at hello.c:8
(gdb) up
#1  0x08049166 in c (c=1) at hello.c:2
2       void c(int c) { d(0); }
The output displays that the current frame is moved to
c, and shows where c is currently executing:
line 2, where the call to d is made. Commands such as
print now operate on the variables of c.
6.3.11 Command: down
Similar to up, this command goes down one frame later
than the current frame.
Example 6.29. After inspecting the c
function, we can go back to d:
(gdb) bt
#0  d (d=0) at hello.c:1
#1  0x08049166 in c (c=1) at hello.c:2
#2  0x08049176 in b (b=2) at hello.c:3
#3  0x08049186 in a (a=3) at hello.c:4
#4  0x08049196 in main (argc=1, argv=0xffffddc4) at hello.c:8
(gdb) up
#1  0x08049166 in c (c=1) at hello.c:2
2       void c(int c) { d(0); }
(gdb) down
#0  d (d=0) at hello.c:1
1       void d(int d) { };
6.3.12 Command:
info registers
This command lists the current values in commonly used registers. This command is useful when debugging assembly and operating system code, as we can inspect the current state of the machine.
Example 6.30. Executing the command while stopped at
the breakpoint in main of the hello program, we can see the
commonly used registers:
(gdb) info registers
eax            0x804907d           134516861
ecx            0xffffdd10          -8944
edx            0xffffdd30          -8912
ebx            0xf7face14          -134558188
esp            0xffffdcf0          0xffffdcf0
ebp            0xffffdcf8          0xffffdcf8
esi            0x804bf04           134528772
edi            0xf7ffcb60          -134231200
eip            0x8049177           0x8049177 <main+17>
eflags         0x286               [ PF SF IF ]
cs             0x23                35
ss             0x2b                43
ds             0x2b                43
es             0x2b                43
fs             0x0                 0
gs             0x63                99
k0             0x0                 0
k1             0x0                 0
k2             0x0                 0
k3             0x0                 0
k4             0x0                 0
k5             0x0                 0
k6             0x0                 0
k7             0x0                 0
Each register is shown in hex and then in a form that depends on the
register: a signed decimal for the general purpose registers, an address
for esp and ebp, the address and the nearest
symbol for eip, which confirms that we are stopped at
main+17, and for eflags the list of the flags
that are set, here the parity, sign and interrupt enable flags. The
registers k0 to k7 are the mask registers of
the AVX-512 extension; gdb lists them only if your CPU has
them, and they are of no concern to us. The above registers suffice for
writing our operating system in the later part.
6.4 How debuggers work: A brief introduction
6.4.1 How breakpoints work
When a programmer places a breakpoint somewhere in his code, what
actually happens is that the first opcode of the first
instruction of a statement is replaced with another instruction,
int 3 with opcode CCh. Take the breakpoint at
line 5 of our hello program, whose first instruction is
sub esp,0xc, encoded as 83 ec 0c (example
6.10). The debugger overwrites the first byte, 83, with
cc:
83 ec 0c            →      cc ec 0c
sub esp,0xc                int 3
int 3 only costs a single byte, making it efficient for
debugging. When the int 3 instruction is executed, the
operating system calls its breakpoint interrupt handler. The handler
then checks what process reaches a breakpoint, pauses it and notifies
the debugger it has paused a debugged process. The debugged process is
only paused and that means a debugger is free to inspect its internal
state, like a surgeon operates on an anesthetized patient. Then, the
debugger puts the original opcode 83 back in place of
cc, sets eip back to the start of the
instruction and executes the original instruction normally. The two
bytes ec 0c left behind the cc are never
executed, as int 3 is one byte long and the debugger
restores the instruction before letting the process continue:
cc ec 0c            →      83 ec 0c
int 3                      sub esp,0xc
Example 6.31. It is simple to see int 3
in action. First, we add an int 3 instruction where we need
gdb to stop:
hello.c
#include <stdio.h>

int main(int argc, char *argv[])
{
    asm("int 3");
    printf("Hello World\n");
    return 0;
}
int 3 precedes printf, so gdb
is expected to stop at printf. Next, we compile with debug
info enabled and with Intel syntax, so that the inline assembly is
understood by gcc:
$ gcc -masm=intel $BOOKFLAGS -g hello.c -o helloFinally, start gdb:
$ gdb helloRunning without setting any breakpoint, gdb stops at the
printf call, as expected:
(gdb) r
Starting program: /tmp/hello

Program received signal SIGTRAP, Trace/breakpoint trap.
main (argc=1, argv=0xffffddc4) at hello.c:6
6           printf("Hello World\n");
The line
Program received signal SIGTRAP, Trace/breakpoint trap.
indicates that gdb encountered a breakpoint, and indeed it
stopped at the right place: the printf call, where
int 3 preceded it. gdb reports a signal rather
than Breakpoint 1 because this int 3 is not
one it placed itself, so it has no breakpoint number to associate with
it.
6.4.2 Single stepping
Once breakpoints are implemented, it is tempting to implement single
stepping with them: a debugger would simply place another
int 3 opcode on the next instruction. This can work, but
the debugger must then decode the current instruction to find where the
next one starts, and when the current instruction is a jump, a
conditional jump or a call, it must compute where execution will go. x86
provides a simpler mechanism: the trap flag, bit 8 of the
eflags register. When the trap flag is set, the processor
raises a debug exception, interrupt 1, after executing every single
instruction. The operating system handles the exception and pauses the
process, exactly as it does for int 3; the debugger
inspects the process and resumes it, and the next instruction raises the
next exception. This is how si works, and the debugger has
no need to understand the instructions at all. The trap flag is
described in Intel SDM Volume 3A, section 2.3, “System Flags and Fields
in the EFLAGS Register”, and the section “Single-Step Exception” of the
chapter on debugging in the same volume. On Linux, a debugger asks the
kernel to set the flag with the ptrace system call.
With instruction stepping and breakpoints, source line by line
debugging follows: ni is si with a temporary
breakpoint placed after a call instruction, so that the
called function runs at full speed; next and
step repeat these until the current address leaves the
range of addresses of the current line, which the debugger knows from
the line number table described below.
6.4.3 How a debugger understands high level source code
DWARF is a debugging file format used by many compilers and debuggers to support source level debugging. DWARF contains information that maps between entities in the executable binary and the source files. A program entity can either be data or code. A DIE, or Debugging Information Entry, is a description of a program entity. A DIE consists of a tag, which specifies the entity that the DIE describes, and a list of attributes that describe the entity. Of all the attributes, these two attributes enable source-level debugging:
Where the entity appears in the source files: which file and which line the entity appears in.
Where the entity appears in the executable binary: at which memory address the entity is loaded at runtime. With the precise address,
gdbcan retrieve the correct value for a data entity, or place a correct breakpoint and stop accordingly for a code entity. Without the information of these addresses,gdbwould not know where the entities are to inspect them.
For example, the DIE of main records that
main is declared at line 3 of hello.c and that
its code starts at 0x8049166 in hello. When
the programmer asks for a breakpoint on main,
gdb finds the DIE by name, reads the address, and places
the int 3 there; when the process stops, gdb
finds the DIE that covers eip and shows the source
line.
In addition to DIEs, another binary-to-source mapping is the line number table. The line number table maps between a line in the source code and the memory address at which the line starts in the executable binary.
In sum, to successfully enable source-level debugging, a debugger
needs to know the precise location of the source files and the load
addresses at runtime. Address matching, between the image layout of the
ELF binary and the address where it is loaded, is extremely important
since debug information relies on the correct loading address at
runtime. That is, it assumes the addresses as recorded in the binary
image at compile-time are the same as at runtime e.g. if the load
address for the .text section is recorded in the executable
binary at 0x800000, then when the binary actually runs,
.text should really be loaded at 0x800000 for
gdb to be able to correctly match running instructions with high-level
code statements. Address mismatching makes debug information useless, as
actual code at one address is displayed as code at another address.
Without this knowledge, we will not be able to build an operating system
that can be debugged with gdb.
Example 6.32. When an executable binary contains
debug info, readelf can display such information in a
readable format. Using the good old hello world program:
hello.c
and compile with debug info:
$ gcc -masm=intel $BOOKFLAGS -g hello.c -o helloWith the binary ready, we can look at the line number table with the command:
$ readelf -wL helloThe -w option prints all the debug information. In
combination with its sub-options, only specific information is
displayed. For example, with -L, only the line number table
is displayed:
Contents of the .debug_line section:

hello.c:
File name                        Line number    Starting address    View    Stmt
hello.c                                    4           0x8049166               x
hello.c                                    5           0x8049177               x
hello.c                                    7           0x8049187               x
hello.c                                    8           0x804918c               x
hello.c                                    -           0x8049194
From the above output:
- CU
-
shorts for Compilation Unit, a separately compiled source file. Each table is headed by the name of its compilation unit. In the example, we only have one file,
hello.c. - File name
-
displays the filename of the current compilation unit.
- Line number
-
is the line number in the source file. Only lines that produce code appear: the empty line 6 and the function signature at line 3 are absent. The last row has no line number: it marks the end of the table, that is, the first address after the code of the compilation unit.
- Starting address
-
is the memory address where the line actually starts in the executable binary.
- View
-
is only used with optimized code, where several rows can share one address; it is empty for us.
- Stmt
-
marks the rows where a statement begins, which is where
gdbputs a breakpoint on that line.
With such crystal clear information, this is how gdb is
able to set a breakpoint on a line easily. For placing breakpoints on
variables and functions, it is time to look at the DIEs. To get the DIEs
information from an executable binary, run the command:
$ readelf -wi helloThe -wi option lists all the DIE entries. This is the
header of the compilation unit followed by its first, typical DIE
entry:
  Compilation Unit @ offset 0:
   Length:        0xaf (32-bit)
   Version:       5
   Unit Type:     DW_UT_compile (1)
   Abbrev Offset: 0
   Pointer Size:  4
 <0><c>: Abbrev Number: 4 (DW_TAG_compile_unit)
    <d>   DW_AT_producer    : (indirect string, offset: 0x51): GNU C17 14.2.0 -masm=intel -m32 -mtune=generic -march=i686 -g -O0 -fno-pie -fno-asynchronous-unwind-tables -fcf-protection=none
    <11>   DW_AT_language    : 29       (C11)
    <12>   DW_AT_name        : (indirect line string, offset: 0): hello.c
    <16>   DW_AT_comp_dir    : (indirect line string, offset: 0x8): /tmp
    <1a>   DW_AT_low_pc      : 0x8049166
    <1e>   DW_AT_high_pc     : 0x2e
    <22>   DW_AT_stmt_list   : 0
The header tells the version of the DWARF format, 5, which is the
current one and the default of gcc 14, and the size of a
pointer, 4 bytes, since we are compiling 32-bit code. Then come the
DIEs:
- Nesting level
-
The left-most number in angle brackets,
<0>, indicates the current nesting level of a DIE entry.0is the outer-most level DIE, whose entity is the compilation unit. This means subsequent DIE entries with a higher nesting level are all the children of this tag, the compilation unit. It makes sense, as all the entities must originate from a source file. - Offset
-
The second number in angle brackets,
<c>, and the numbers in front of each attribute,<d>,<11>…, are offsets in hex into the.debug_infosection. Each meaningful piece of information is displayed along with its offset. When an attribute references another DIE, the offset is used to precisely identify the referenced DIE. - Attributes
-
The names with the
DW_AT_prefix are the attributes attached to a DIE that describe an entity. Notable attributes: DW_AT_nameDW_AT_comp_dir-
The filename of the compilation unit and the directory where compilation occurred. Without the filename and the path,
gdbwould not be able to display the high-level source, despite the availability of the debug info. Debug info only contains the mapping between source and binary, not the source code itself. The values are indirect strings: the DIE holds an offset into a string table,.debug_stror.debug_line_str(the “line string” table, shared with the line number table), andreadelfresolves it for us. DW_AT_low_pcDW_AT_high_pc-
The start and end of the current entity, which is the compilation unit, in the executable binary. The value in
DW_AT_low_pcis the starting address.DW_AT_high_pcis the size of the compilation unit, which when added toDW_AT_low_pcresults in the end address of the entity. In this example, code compiled fromhello.cstarts at0x8049166and ends at0x8049166+0x2e=0x8049194. To really make sure, we verify withobjdump, asking it to interleave the source with-S:$ objdump -M intel -S hello 08049166 <main>: #include <stdio.h> int main(int argc, char *argv[]) { 8049166: 8d 4c 24 04 lea ecx,[esp+0x4] 804916a: 83 e4 f0 and esp,0xfffffff0 804916d: ff 71 fc push DWORD PTR [ecx-0x4] 8049170: 55 push ebp 8049171: 89 e5 mov ebp,esp 8049173: 51 push ecx 8049174: 83 ec 04 sub esp,0x4 printf("Hello World\n"); 8049177: 83 ec 0c sub esp,0xc 804917a: 68 08 a0 04 08 push 0x804a008 804917f: e8 bc fe ff ff call 8049040 <puts@plt> 8049184: 83 c4 10 add esp,0x10 return 0; 8049187: b8 00 00 00 00 mov eax,0x0 } 804918c: 8b 4d fc mov ecx,DWORD PTR [ebp-0x4] 804918f: c9 leave 8049190: 8d 61 fc lea esp,[ecx-0x4] 8049193: c3 ret Disassembly of section .fini: 08049194 <_fini>: 8049194: 53 push ebx 8049195: 83 ec 08 sub esp,0x8It is true:
mainstarts at8049166and ends at8049194, right after theretinstruction at8049193. It is also the last address of the line number table above. What follows at8049194is_fini, in another section, which does not belong tomain. Note that the output fromobjdumpshows much more code beforemain. It is not counted, as the code is outside ofhello.c, added bygccfor the operating system.hello.ccontains only one function:main, and this is whyhello.calso starts and ends at the same addresses asmain. - Abbrev Number
-
This number displays the abbreviation form of a tag. An abbreviation is the form of a DIE. When debug info is displayed with
-wi, the DIEs are displayed with their values. The-waoption shows the abbreviations in the.debug_abbrevsection:Contents of the .debug_abbrev section:
Number TAG (0)
 1      DW_TAG_base_type    [no children]
  DW_AT_byte_size    DW_FORM_data1
  DW_AT_encoding     DW_FORM_data1
  DW_AT_name         DW_FORM_strp
  DW_AT value: 0     DW_FORM value: 0
…. abbreviations 2 and 3 …. 4 DW_TAG_compile_unit [has children] DW_AT_producer DW_FORM_strp DW_AT_language DW_FORM_data1 DW_AT_name DW_FORM_line_strp DW_AT_comp_dir DW_FORM_line_strp DW_AT_low_pc DW_FORM_addr DW_AT_high_pc DW_FORM_data4 DW_AT_stmt_list DW_FORM_sec_offset DW_AT value: 0 DW_FORM value: 0 …. more abbreviations ….
The output is similar to a DIE output, with only attribute names and
without any value. Abbreviation 4 is the one our compilation unit DIE
refers to with Abbrev Number: 4: it lists exactly the
attributes we saw, in the same order, and next to each attribute the
form in which its value is encoded in the DIE:
DW_FORM_strp and DW_FORM_line_strp are offsets
into the string tables, DW_FORM_addr is an address,
DW_FORM_data1 and DW_FORM_data4 are constants
of 1 and 4 bytes. We can also say an abbreviation is a type of
a DIE, as an abbreviation represents the structure of a particular DIE.
Many DIEs share the same abbreviation, or structure, thus they are of
the same type: the eleven DW_TAG_base_type DIEs of
hello all refer to abbreviation 1 or 5. An abbreviation
number specifies which type a DIE is in the abbreviation table above.
Abbreviations improve encoding efficiency (reduce binary size) because
each DIE needs not carry its structure information as pairs of
attribute-value2, but simply refers to an
abbreviation for correct decoding.
Here are all the DIEs of hello represented as a tree:
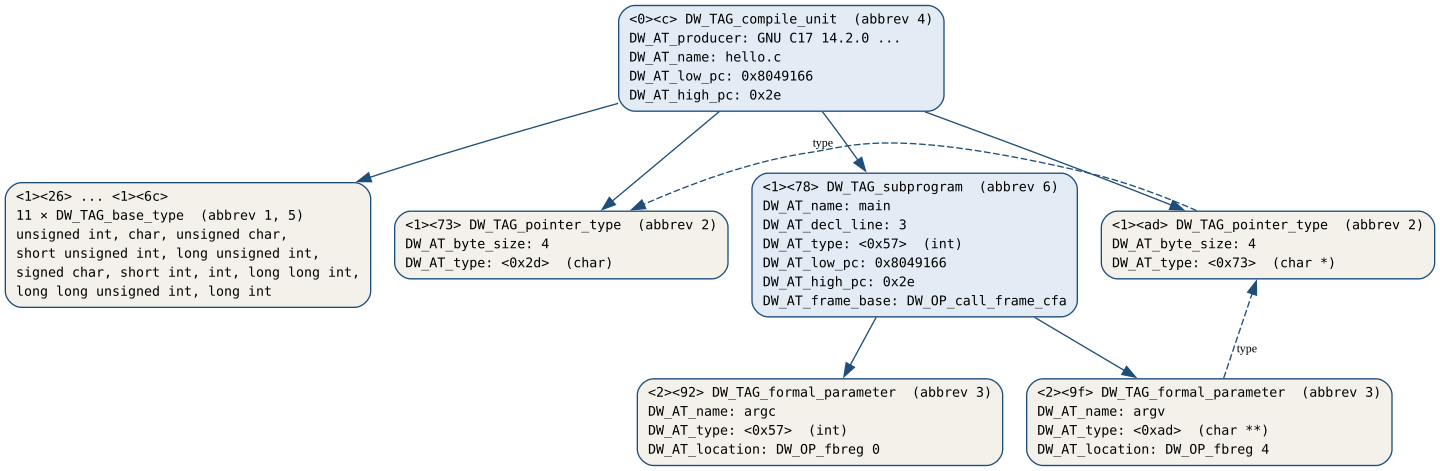
In figure 6.1, DW_TAG_subprogram represents a function
such as main. Its children are the DIEs of
argc and argv. With such precise information,
matching source to binary is an easy job for gdb.
If more than one compilation unit exists in an executable binary, the
DIE entries are sorted according to the compilation order from
gcc. For example, suppose we have another
test.c source file3:
test.c
void bar() {}and compile it together with hello:
$ gcc -masm=intel $BOOKFLAGS -g test.c hello.c -o helloThen, all the DIE entries in test.c are displayed before
the DIE entries in hello.c:
Contents of the .debug_info section:

  Compilation Unit @ offset 0:
   Length:        0x35 (32-bit)
   Version:       5
   Unit Type:     DW_UT_compile (1)
   Abbrev Offset: 0
   Pointer Size:  4
 <0><c>: Abbrev Number: 1 (DW_TAG_compile_unit)
    <d>   DW_AT_producer    : (indirect string, offset: 0): GNU C17 14.2.0 -masm=intel -m32 -mtune=generic -march=i686 -g -O0 -fno-pie -fno-asynchronous-unwind-tables -fcf-protection=none
    <11>   DW_AT_language    : 29       (C11)
    <12>   DW_AT_name        : (indirect line string, offset: 0x5): test.c
    <16>   DW_AT_comp_dir    : (indirect line string, offset: 0): /tmp
    <1a>   DW_AT_low_pc      : 0x8049166
    <1e>   DW_AT_high_pc     : 0x6
    <22>   DW_AT_stmt_list   : 0
 <1><26>: Abbrev Number: 2 (DW_TAG_subprogram)
    <27>   DW_AT_external    : 1
    <27>   DW_AT_name        : bar
    <2b>   DW_AT_decl_file   : 1
    <2c>   DW_AT_decl_line   : 1
    <2d>   DW_AT_decl_column : 6
    <2e>   DW_AT_low_pc      : 0x8049166
    <32>   DW_AT_high_pc     : 0x6
    <36>   DW_AT_frame_base  : 1 byte block: 9c         (DW_OP_call_frame_cfa)
    <38>   DW_AT_call_all_calls: 1
 <1><38>: Abbrev Number: 0
  Compilation Unit @ offset 0x39:
   Length:        0xaf (32-bit)
   Version:       5
   Unit Type:     DW_UT_compile (1)
   Abbrev Offset: 0x2b
   Pointer Size:  4
 <0><45>: Abbrev Number: 4 (DW_TAG_compile_unit)
    <46>   DW_AT_producer    : (indirect string, offset: 0): GNU C17 14.2.0 -masm=intel -m32 -mtune=generic -march=i686 -g -O0 -fno-pie -fno-asynchronous-unwind-tables -fcf-protection=none
    <4a>   DW_AT_language    : 29       (C11)
    <4b>   DW_AT_name        : (indirect line string, offset: 0xc): hello.c
    <4f>   DW_AT_comp_dir    : (indirect line string, offset: 0): /tmp
    <53>   DW_AT_low_pc      : 0x804916c
    <57>   DW_AT_high_pc     : 0x2e
    <5b>   DW_AT_stmt_list   : 0x48
....then all DIEs in hello.c are listed....
The compilation unit of test.c is small: its only child
is the DIE of bar, whose 6 bytes of code occupy
0x8049166 to 0x804916c, and the DIE with
Abbrev Number: 0 marks the end of the children. The
compilation unit of hello.c then starts at offset
0x39 in .debug_info, and its code now starts
at 0x804916c, right after bar.
6.5 Exercises
Every exercise uses a program of this chapter, compiled with
gcc $BOOKFLAGS -g as in section 6.1, and gdb
16 from the container of chapter 0. Keep the gdb manual at hand:
help <command> inside gdb gives the short version,
and info gdb the full one.
Exercise 6.1. A watchpoint stops the
program when the value of a variable changes, whoever changes it.
Compile the add1000 program of example 6.24, set a
breakpoint on add1000, run, then type
watch total and continue three or four times:
at every stop, gdb prints the old and the new value. Explain the “Old
value” of the first stop, a large meaningless number, and the sequence
of new values that follows. info watchpoints lists it as a
hw watchpoint: read “Setting Watchpoints” in the gdb manual
to find out what the processor does for gdb here, and compare with what
gdb has to do by itself for a breakpoint (section 6.4.1, How breakpoints
work). Then delete the watchpoint and set a
conditional one, watch total if total > 1000:
at which iteration does the program stop? Check with
print i. Finally, start over with a conditional breakpoint,
break 7 if i == 500, and print total; compute
the value you expect before looking at it. info breakpoints
says how many times the breakpoint was hit; find out how many times gdb
actually stopped the process to get there, and who evaluates the
condition, the processor or gdb.
Exercise 6.2. Compile the chain of calls of example
6.27, break on d, run, and type info frame.
The output names the address of the frame, the saved eip,
and the addresses where the ebp and eip of the
caller were saved. Now dump the stack from ebp upward with
x/6xw $ebp and identify each word with the frame layout of
chapter 4, x86 Assembly and C: the saved ebp of
c, the return address into c (the number
bt prints for frame #1), the argument d, and
then the frame of c itself. Type up, then
info frame again, and find which of the numbers you already
know reappear. Finally finish out of d and
dump the three words below the new esp with
x/3xw $esp-12: the frame of d is gone as far
as the program is concerned, but what is still in memory?
Exercise 6.3. How does gdb know where
argc is? In the output of readelf -wi hello
(example 6.32), find the DIE of the formal parameter argc,
a child of the DW_TAG_subprogram DIE of main,
and its attribute DW_AT_location: DW_OP_fbreg 0:
argc is at offset 0 from the frame base, which the
DIE of main defines as DW_OP_call_frame_cfa.
The canonical frame address is the value esp had
in the caller just before the call instruction, which is
also the address of the first argument. Check the chain: stop at the
breakpoint in main and compare print &argc
with the “frame at” address of info frame. Chapter 4 placed
the first argument of a function at [ebp+0x8]: compare
print &argc with print $ebp+8. They
differ; find out why in the prologue of main in example
6.9, and verify your explanation on add in the program of
example 6.21, where print &a and
print $ebp+8 agree. info scope main and
info address argc show how gdb reads the same
attribute.
Exercise 6.4. objdump reads DWARF too:
objdump --dwarf=decodedline hello prints the line number
table of example 6.32 and objdump --dwarf=info hello the
DIEs. Take the program of example 6.21, main and
add, and before running any tool, write down the line table
you expect: which lines appear, in which order, and at which addresses
relative to the start of add and of main. Then
compare with the tool, and with info line 4 in gdb. Now
recompile the add1000 program of example 6.24 with
-O2 -g instead of -O0 -g, and look at its line
table: many lines now share one address, and the View
column is used. Run it under gdb with break add1000,
next and print total, and explain from the
line table and from disassemble add1000 what the optimizer
did to the loop, and why source-level debugging of optimized code is
unreliable. This is why the book compiles everything with
-O0.
Exercise 6.5. Typing
set disassembly-flavor intel at every start is tedious, and
a kernel needs more setup still, as chapter 7, Bootloader, will show.
Write a file .gdbinit in the directory of
hello with the lines:
set disassembly-flavor intel
break main
run
define here
  x/i $eip
  info frame
end
and start gdb hello from that directory: gdb executes
the file, stops in main, and here is now a
command of your own; help user-defined lists it. The gdb of
the container runs any .gdbinit it finds in the current
directory because its system configuration,
/etc/gdb/gdbinit, allows it; the gdb of a distribution
usually refuses with a warning that explains how to allow it, and
gdb -x .gdbinit hello always works. Why is refusing the
safe default? Look up the shell and python
commands in the gdb manual, then imagine cloning an unknown repository
that ships a .gdbinit. Extend the file as you see fit:
display/i $eip to show the next instruction at every stop,
set confirm off, a define that prints the
registers you look at most.
Exercise 6.6. Compile bitfield.c of
chapter 4 with -g and type
ptype /o struct bit_field2 in gdb: the offset and the size
of every member are printed, with the padding, and explain the eight
bytes that the section on bit fields of chapter 4 had to read off an
objdump listing. Verify with print/x bf2 and
x/8xb &bf2. Then compile the same file without
-g. print bf2 now fails with
'bf2' has unknown type, but the symbol table of chapter 5
still gives the address and the size of each variable
(info variables bf, or readelf -W -s). From
x/8xb &bf2 and x/4xw &ns alone, write
down the layout of both structs, then read the members by casting the
address: print ((unsigned char *)&bf2)[4],
print/x *(int *)&ns@4. This is the situation you are in
when the binary was built by someone else, or when the debug information
of a kernel is wrong: the memory is right there, and the layout has to
be reconstructed.
6.6 Milestone project: an ELF inspector
Part I closes here. The three tools we have used,
objdump, readelf and gdb, have
one thing in common: they are ordinary programs that read a file and
decode structures whose layout is public. Before writing an operating
system that will have to do exactly that with its own kernel image, in
chapter 8, Linking and loading on bare metal, and with the programs it
loads, in chapter 15, Address spaces: fork and exec, write the smallest
of these tools yourself.
Goal. Write elfdump.c, a C program
compiled with gcc $BOOKFLAGS, that opens the ELF file named
on its command line and prints its section headers the way
readelf -S does: the index, the name, the type, the
address, the file offset and the size of every section, one line per
section, after a first line giving the number of section headers and the
offset of the table. Use only the standard C library and
<elf.h>.
What you already know. Everything the program needs is in chapters 5 and 6:
The file starts with an ELF header,
Elf32_Ehdrin<elf.h>, whose fields are the onesreadelf -hprints (section 5.2, ELF header):e_shoffis the offset of the section header table,e_shnumthe number of entries,e_shentsizetheir size ande_shstrndxthe index of the section that holds the names. Check the four magic bytes before trusting anything else.The section header table is an array of
e_shnumstructuresElf32_Shdr, each withsh_name,sh_type,sh_addr,sh_offsetandsh_size(section 5.3, Section header table). Read the whole file into memory withfread, or map it withmmap, and cast:Elf32_Shdr *sh = (Elf32_Shdr *)(file + ehdr->e_shoff). No decoding byte by byte is needed: the file is little-endian like the machine, and the structures of<elf.h>have the exact layout of the file.sh_nameis not a string but an offset into the section name string table,.shstrtab, the section at indexe_shstrndx(example 5.12): the name is atfile + sh[ehdr->e_shstrndx].sh_offset + sh[i].sh_name.sh_typeis a number;readelfprintsPROGBITSforSHT_PROGBITS,NOBITSforSHT_NOBITS, and so on. Write that table yourself from theSHT_constants of<elf.h>; the three GNU types of the listings of chapter 5,GNU_HASH,VERSYMandVERNEED, areSHT_GNU_HASH,SHT_GNU_versymandSHT_GNU_verneedin the same header.
Success criterion. Compile the hello.c
of chapter 5 with gcc $BOOKFLAGS hello.c -o hello and run
readelf -W -S hello (-W prints the names in
full). Your program passes when, for every section header of
the file, from [ 0] to the .shstrtab at the
end, the name, type, address, offset and size it prints are the ones
readelf prints. Format your output the same way,
%08x for the address, %06x for the offset and
the size, so that the two listings can be compared with
diff once the columns you do not print are cut out of the
readelf output with cut or awk.
Also check that your program reports an error instead of crashing on a
file that is not an ELF file: ./elfdump hello.c.
Stretch goals.
Add the program header table (
e_phoff,e_phnum,Elf32_Phdr), printed likereadelf -l: type, offset, virtual address, file size, memory size and flags. Then compute, for eachLOADsegment, which sections fall inside it, and reproduce the “Section to Segment mapping” of example 5.19. This is the part of the program a loader actually needs; chapter 15 will do it inside the kernel.Print the symbol table like
readelf -s: find theSHT_SYMTABsection, read itsElf32_Symentries,sh_size / sh_entsizeof them, and take the names from the string table that itssh_linkfield designates; exercise 5.1 told you which one. Check thatmainhas the addressgdbprints forprint main.Support 64-bit files:
Elf64_Ehdr,Elf64_ShdrandElf64_Phdr, chosen after theEI_CLASSbyte of the magic number. Test on the 64-bithelloof the beginning of chapter 5. To avoid writing everything twice, look at howreadelfitself does it, inbinutils/readelf.c.
When a field reads wrong. A wrong number almost
always means a wrong offset, and gdb is the tool to find it. Compile
your inspector with -g, break after the headers are read,
and compare what you see with readelf:
print *ehdr pretty-prints the ELF header with the field
names of <elf.h>, print sh[1] the second
section header, print/x sh[1].sh_offset a single field, and
x/16xb file + ehdr->e_shoff the raw bytes that gdb and
your program are both decoding. If the first entries are right and a
later one is wrong, compare print sizeof(Elf32_Shdr) with
e_shentsize: you may be stepping with the wrong stride. If
a name is garbage, x/s on the address you computed shows
what the string table holds there, and
print ehdr->e_shstrndx whether you looked in the right
section. Finally, ptype /o Elf32_Shdr prints the layout of
the structure as gdb knows it, which is the one of
<elf.h> and of man elf.
6.7 Check your understanding
break 3onhello.csets the breakpoint on line 5 at0x8049177, andbreak mainpicks the same address, althoughmainstarts at0x8049166. Why do both skip the first 17 bytes of the function, and when would you wantbreak *0x8049166instead?gdb reports
Breakpoint 1when it stops on anint 3it planted, andProgram received signal SIGTRAPfor theint 3we wrote ourselves in example 6.31. What does gdb know in the first case that it does not know in the second, and where iseipleft in each case?finishprintsValue returned is $1 = 499500foradd1000, although the program discards the value. Where does gdb read it from, and what does it need the debug information for?If the kernel we are going to write were linked for the address
0x100000but loaded at0x7c00, what would break first, the program or its debugging? Why?Debug information does not contain the source code. What exactly does gdb need from the executable to display
5 printf("Hello World!\n");, and what still works ifhello.cis deleted after compiling?x/20xb mainandx/5i mainprint the same bytes very differently. Why isx/imisleading on a data section, such as the.dataof thebitfieldprogram of chapter 4, and which format would you use there instead?Single stepping could be implemented by planting an
int 3on the next instruction. Why is the trap flag a better single step, and what doesnineed in addition to the trap flag to step over acall?
Why should we add a new function and function call instead of using the existing
printfcall? Stepping into shared library functions is tricky because to make debugging work, the debug info must be installed and loaded. It is not worth the trouble for demonstrating this simple command.↩︎For example, data format such as YAML or JSON encodes its attribute names along with its values. This simplifies encoding, but with overhead.↩︎
It can contain anything. Just a sample file.↩︎